
Semi Data
Visualization.
Partnered with four teams to build an end-to-end data visualization/DV solution from the ground up.
One theme.
Every chart.
SEMI DV · 10 CHART TYPES
UNIFIED VISUAL LANGUAGE
LIVE PREVIEW
CHART · CATEGORY PERFORMANCE
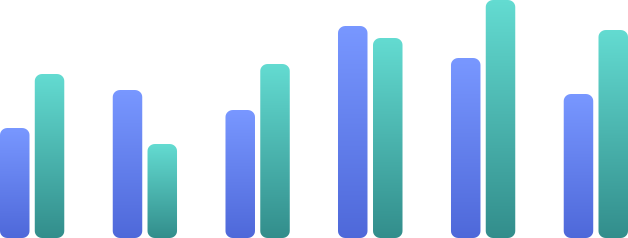
Performance across product areas



DATA
GROWTH
SEARCH
PLATFORM
LIVE
TOOLS
PEAK
+42%
CORE
NEW
GROWTH
THEME BUILDER
Brand in.
System out.
One palette, consistently expressed across
every visualization.

SHARE


68%
PROFILE

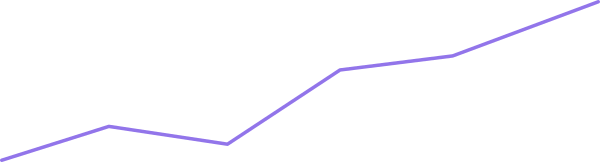
TREND DETAIL

MY ROLE
Project Manager & Product Designer
Problem framing · Strategy · Project management · Product design
TIMELINE
8 months
May 20024 – Dec 2024
TEAM
4 teams & 9 people
5 designers from Platform & Live
4 developers from Semi & VisActor
Summary
One workflow, 4 connected stages.
Instead of solving isolated chart-design problems, we connected the entire workflow from the first design decision to production code.
/ 01 — Define
Theme definition
Default DV theme Theme builder with Simple and Advanced modes
/ 02 — Choose
Chart selection
A decision guide that maps chart types to use cases
/ 03 — Design
Figma creation
A plugin that syncs production themes and inserts editable charts
/ 04 — Build
Engineering delivery
Copy-ready configuration generated directly from Figma


Theme definition
Style
Brand color

#0064FA

Corner radius
Sharp
Default
Round
Spacing
Small
Default
Large
Boldness
Delicate
Default
Bold
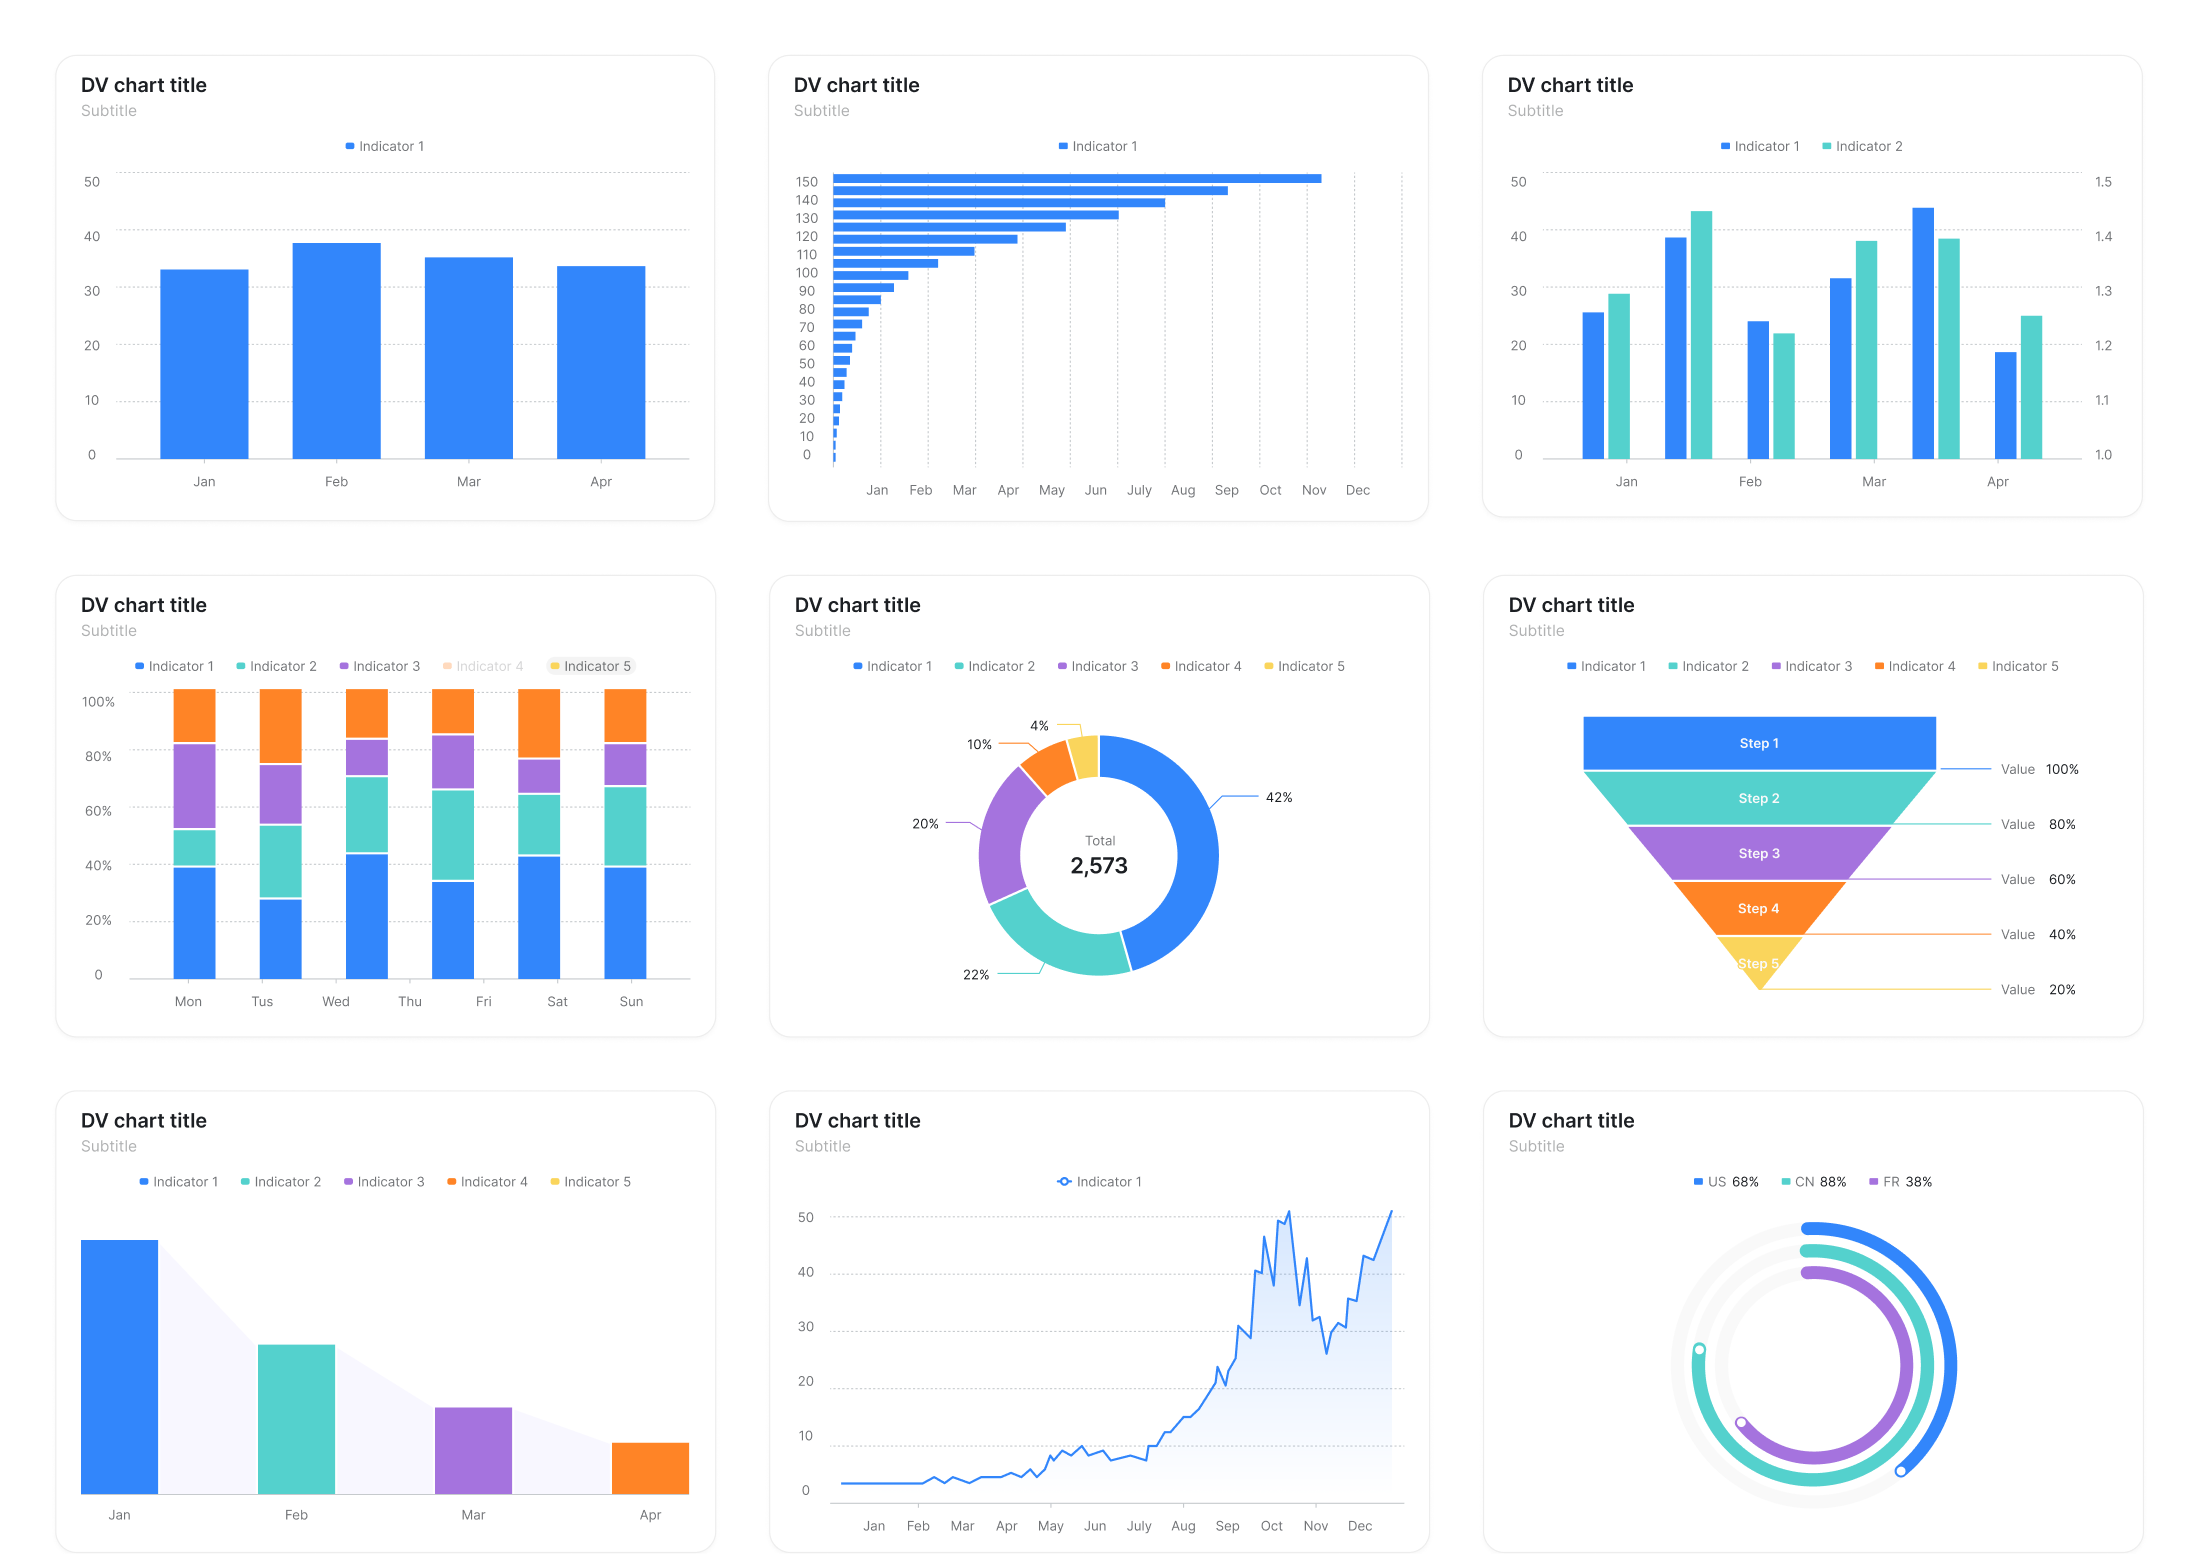


Chart Guideline




Figma creation

Engineering delivery
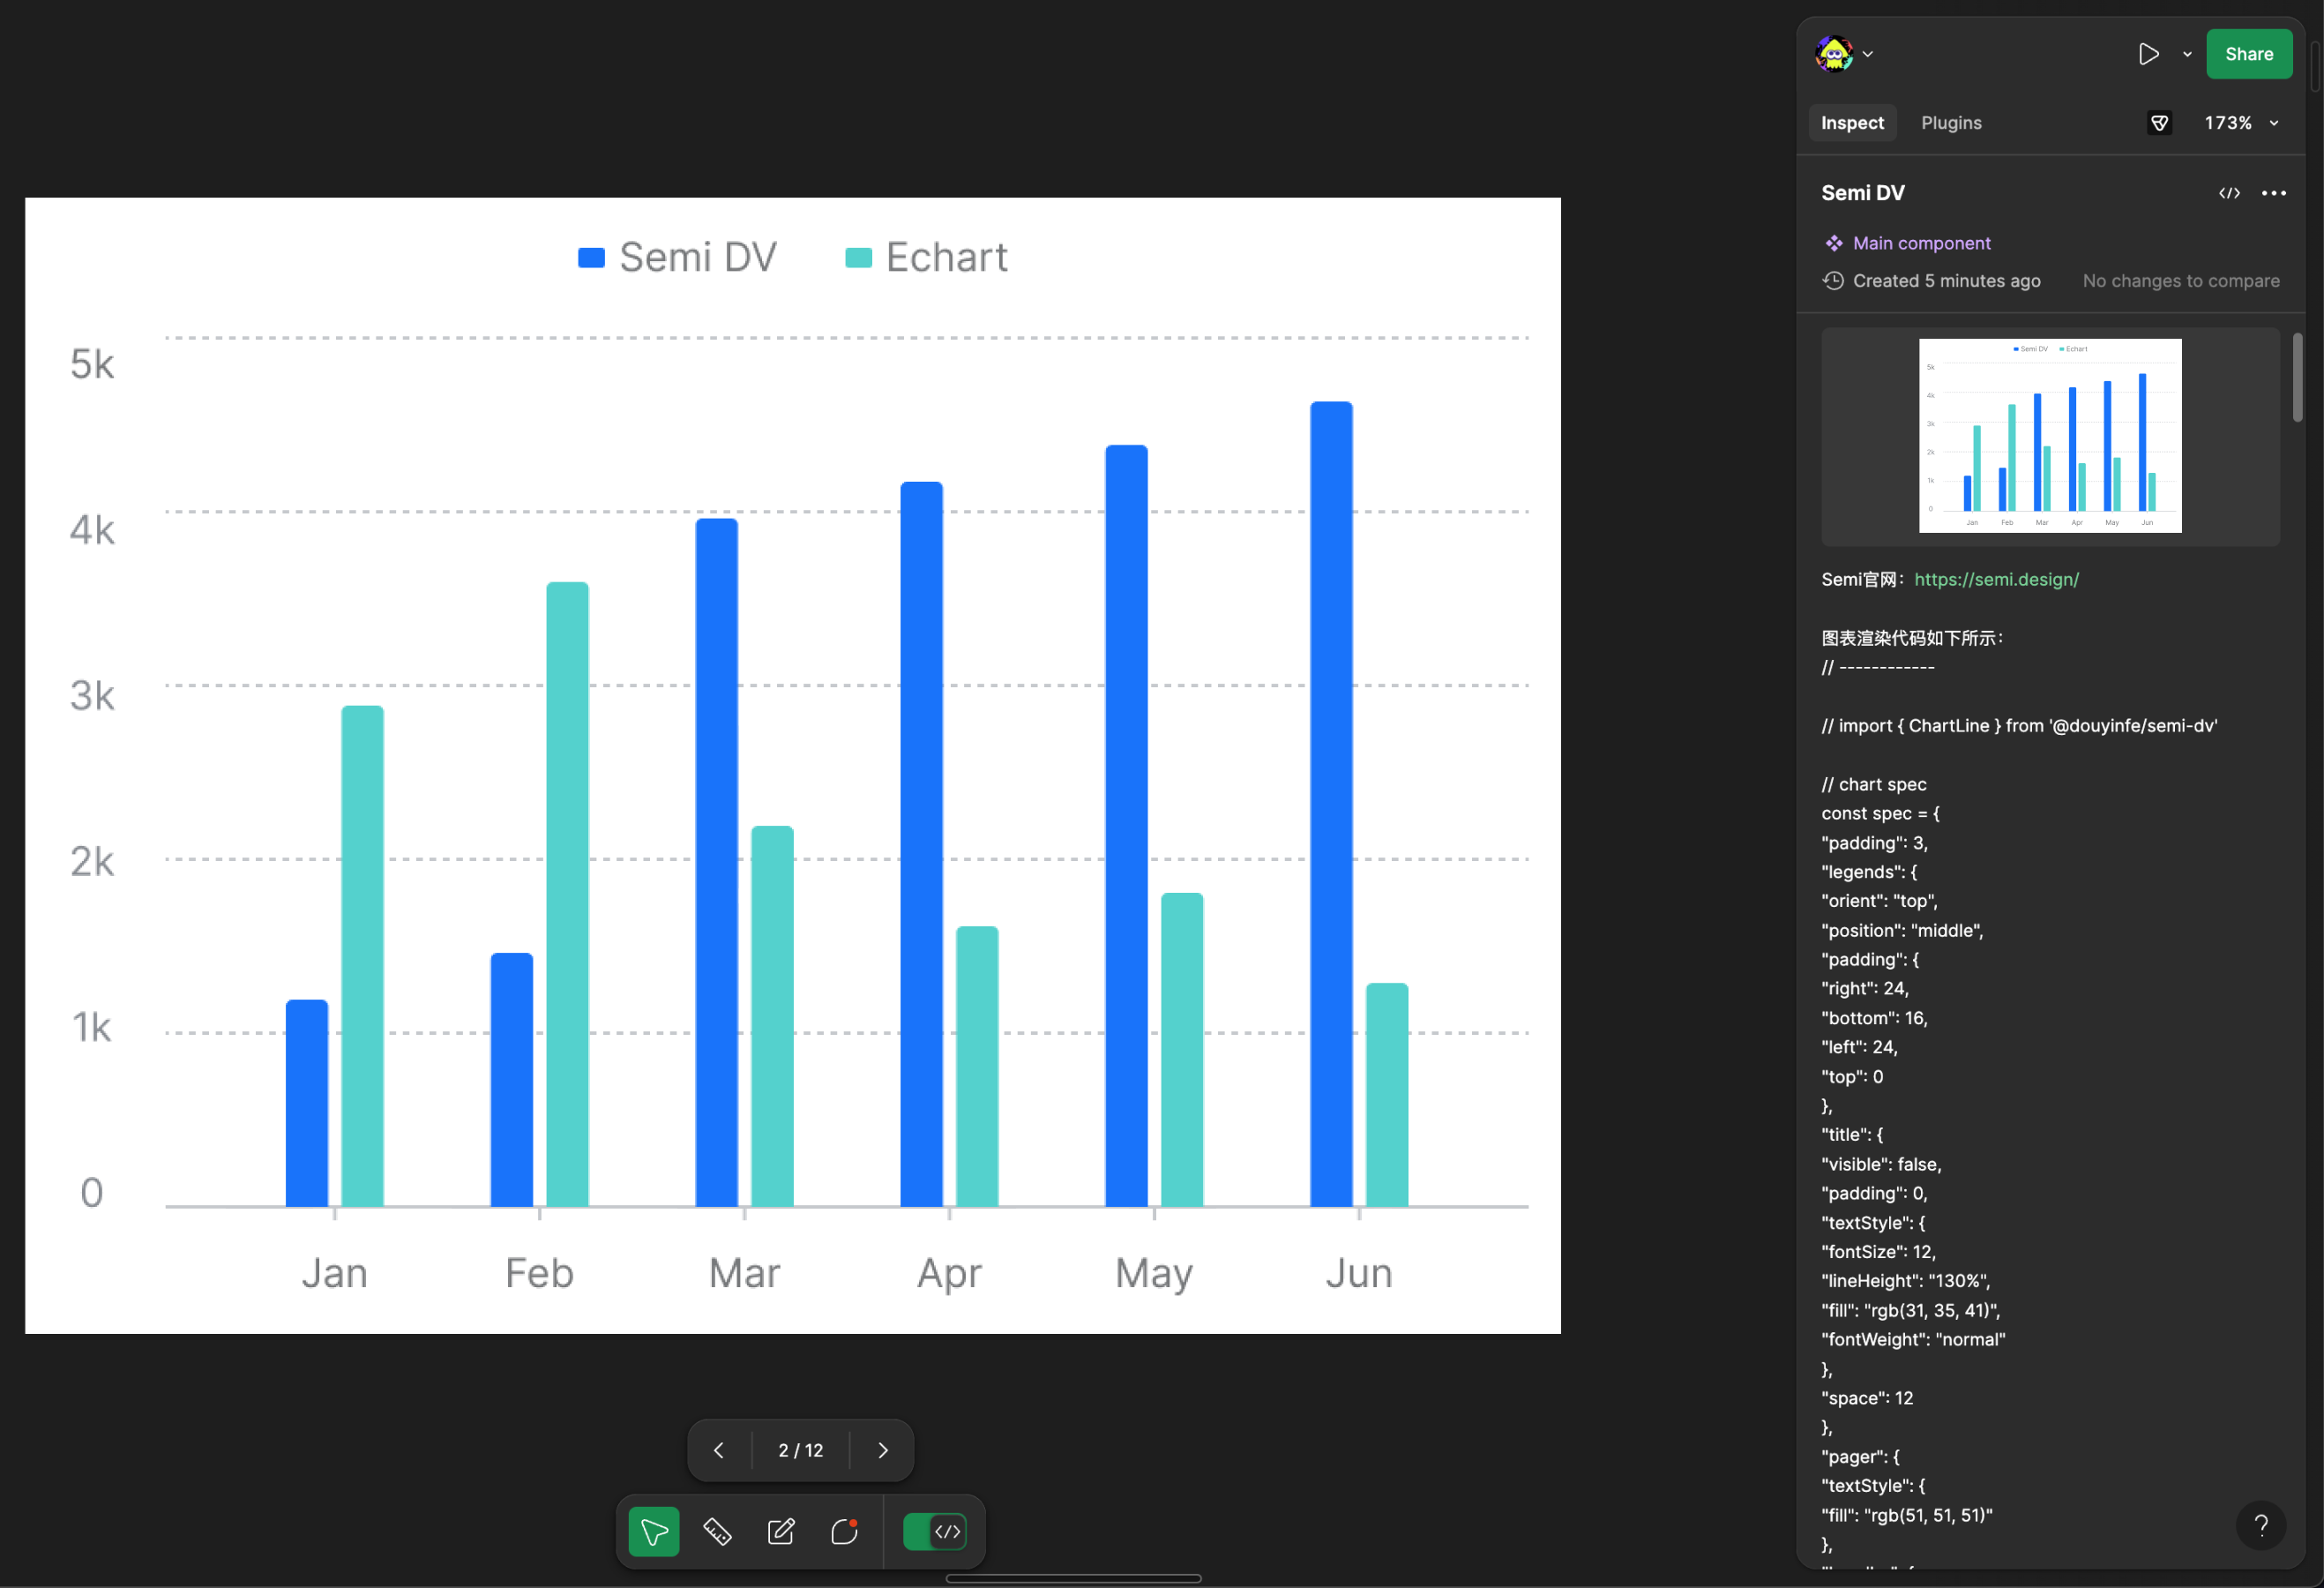
Key results
Theme definition
90→1 pd
/ theme
Chart design
2h→5m
/ chart
Chart development
4h→10m
/ chart
Background
A missing module in a system used at massive scale.
Semi is ByteDance’s widely adopted web design system. It hosts more than 20,000 theme repositories, approximately 68% of which use customized themes.
Yet its chart module was missing.
Our research found that defining a complete set of data visualization components took an average of 90 person-days.
Teams repeatedly defined visualization styles, then developers rebuilt those decisions in code—creating duplicated effort and inconsistent outcomes.
68%
/
13K+
repositories use custom themes
90 pd
Average time to define one DV component set
User research
To understand the challenges designers faced when working with data visualization, I interviewed 32 designers. Among which approximately 85% had worked with data visualization in product design, and around 35% were frequent data visualization users
The research revealed that designers with different levels of experience faced different challenges. These difficulties extended across the entire workflow — from theme definition and chart selection to chart design and engineering handoff.
01 — Defining a chart theme
Beginners - lack of guidance
Designers who worked with data visualization less frequently:
- Had limited knowledge of chart design principles and often configured charts styles according to personal preference
- Wanted a reliable, ready-to-use theme that could be applied immediately
Experts - high configuration costs
Professional and frequent users:
- Had higher expectations for chart quality and brand consistency
- Needed to configure a large number of system-level and chart-level parameters which mostly existed as code, creating a steep learning curve. Designers spent an average of 90 person-days defining a complete charting system
02 — Choosing the right chart
Most designers selected chart types based primarily on personal experience. Without a systematic decision framework, charts were often mismatched with their intended use case.
03 — Applying charts
Manually creating a single chart in Figma usually took at least 30 minutes. Changing its data, style, or chart type often required designers to restructure multiple layers.
After receiving the design, engineers still had to manually recreate the chart configuration. This was time-consuming and made visual fidelity difficult to guarantee.
PROBLEM STATEMENT
How might we help teams with different levels of expertise define, choose, and apply charts efficiently and accurately?
Success metrics
/ 01 — Theme configuration time
Simple system
< 1 day
Complex system
< 2 weeks
/ 02 — Chart application time
Figma creation time / chart
< 5 min
Development time / chart
< 10 min
/ 03 — Post-launch adoption
Semi user adoption rate
> 50%
Strategy
First, I broke the data visualization workflow into four stages and developed a targeted solution for each scenario.
Stage
Define a theme
Choose a chart
Create a chart in Figma
Implement a chart
Problem
High entry barrier and configuration cost
No clear decision framework
Time-consuming manual work in Figma
Manual configuration and inconsistent fidelity
Solution
Ready-to-use default DV theme
Custom theme builder
Chart selection guide
One-click chart insertion through the Figma plugin
Development configuration generated from Figma
/ Prioritization
Prioritize the differentiator.
Connect the rest.
Then I evaluated each opportunity by user value, product differentiation and delivery cost.
The custom theme builder offered the highest value and differentiation. The other stages were scoped to establish a complete MVP workflow first.
Custom
theme
builder
Default
theme
Figma
plugin
Chart
guide
Dev
config
Differentiation
User value
Low cost
High cost
/ Cross-team delivery
Align the foundation first.
Let teams move in parallel.
The project involved four interdependent workstreams: a default theme, a theme builder, a Figma plugin, and engineering capabilities.
I aligned early with engineers on the DV token structure, enabling them to build the foundation before visual details were finalized.
This enabled design and development to progress in parallel, saving approximately three months.
/ 01
DV TOKEN + DATA STRUCTURE
Shared content aligned first

/ 02 — A
DESIGN
Theme, builder, plugin
/ 02 — B
ENGINEERING
Schema, renderer, config
Deliverable 01 - Theme definition
Default DV theme.
A reliable starting point.
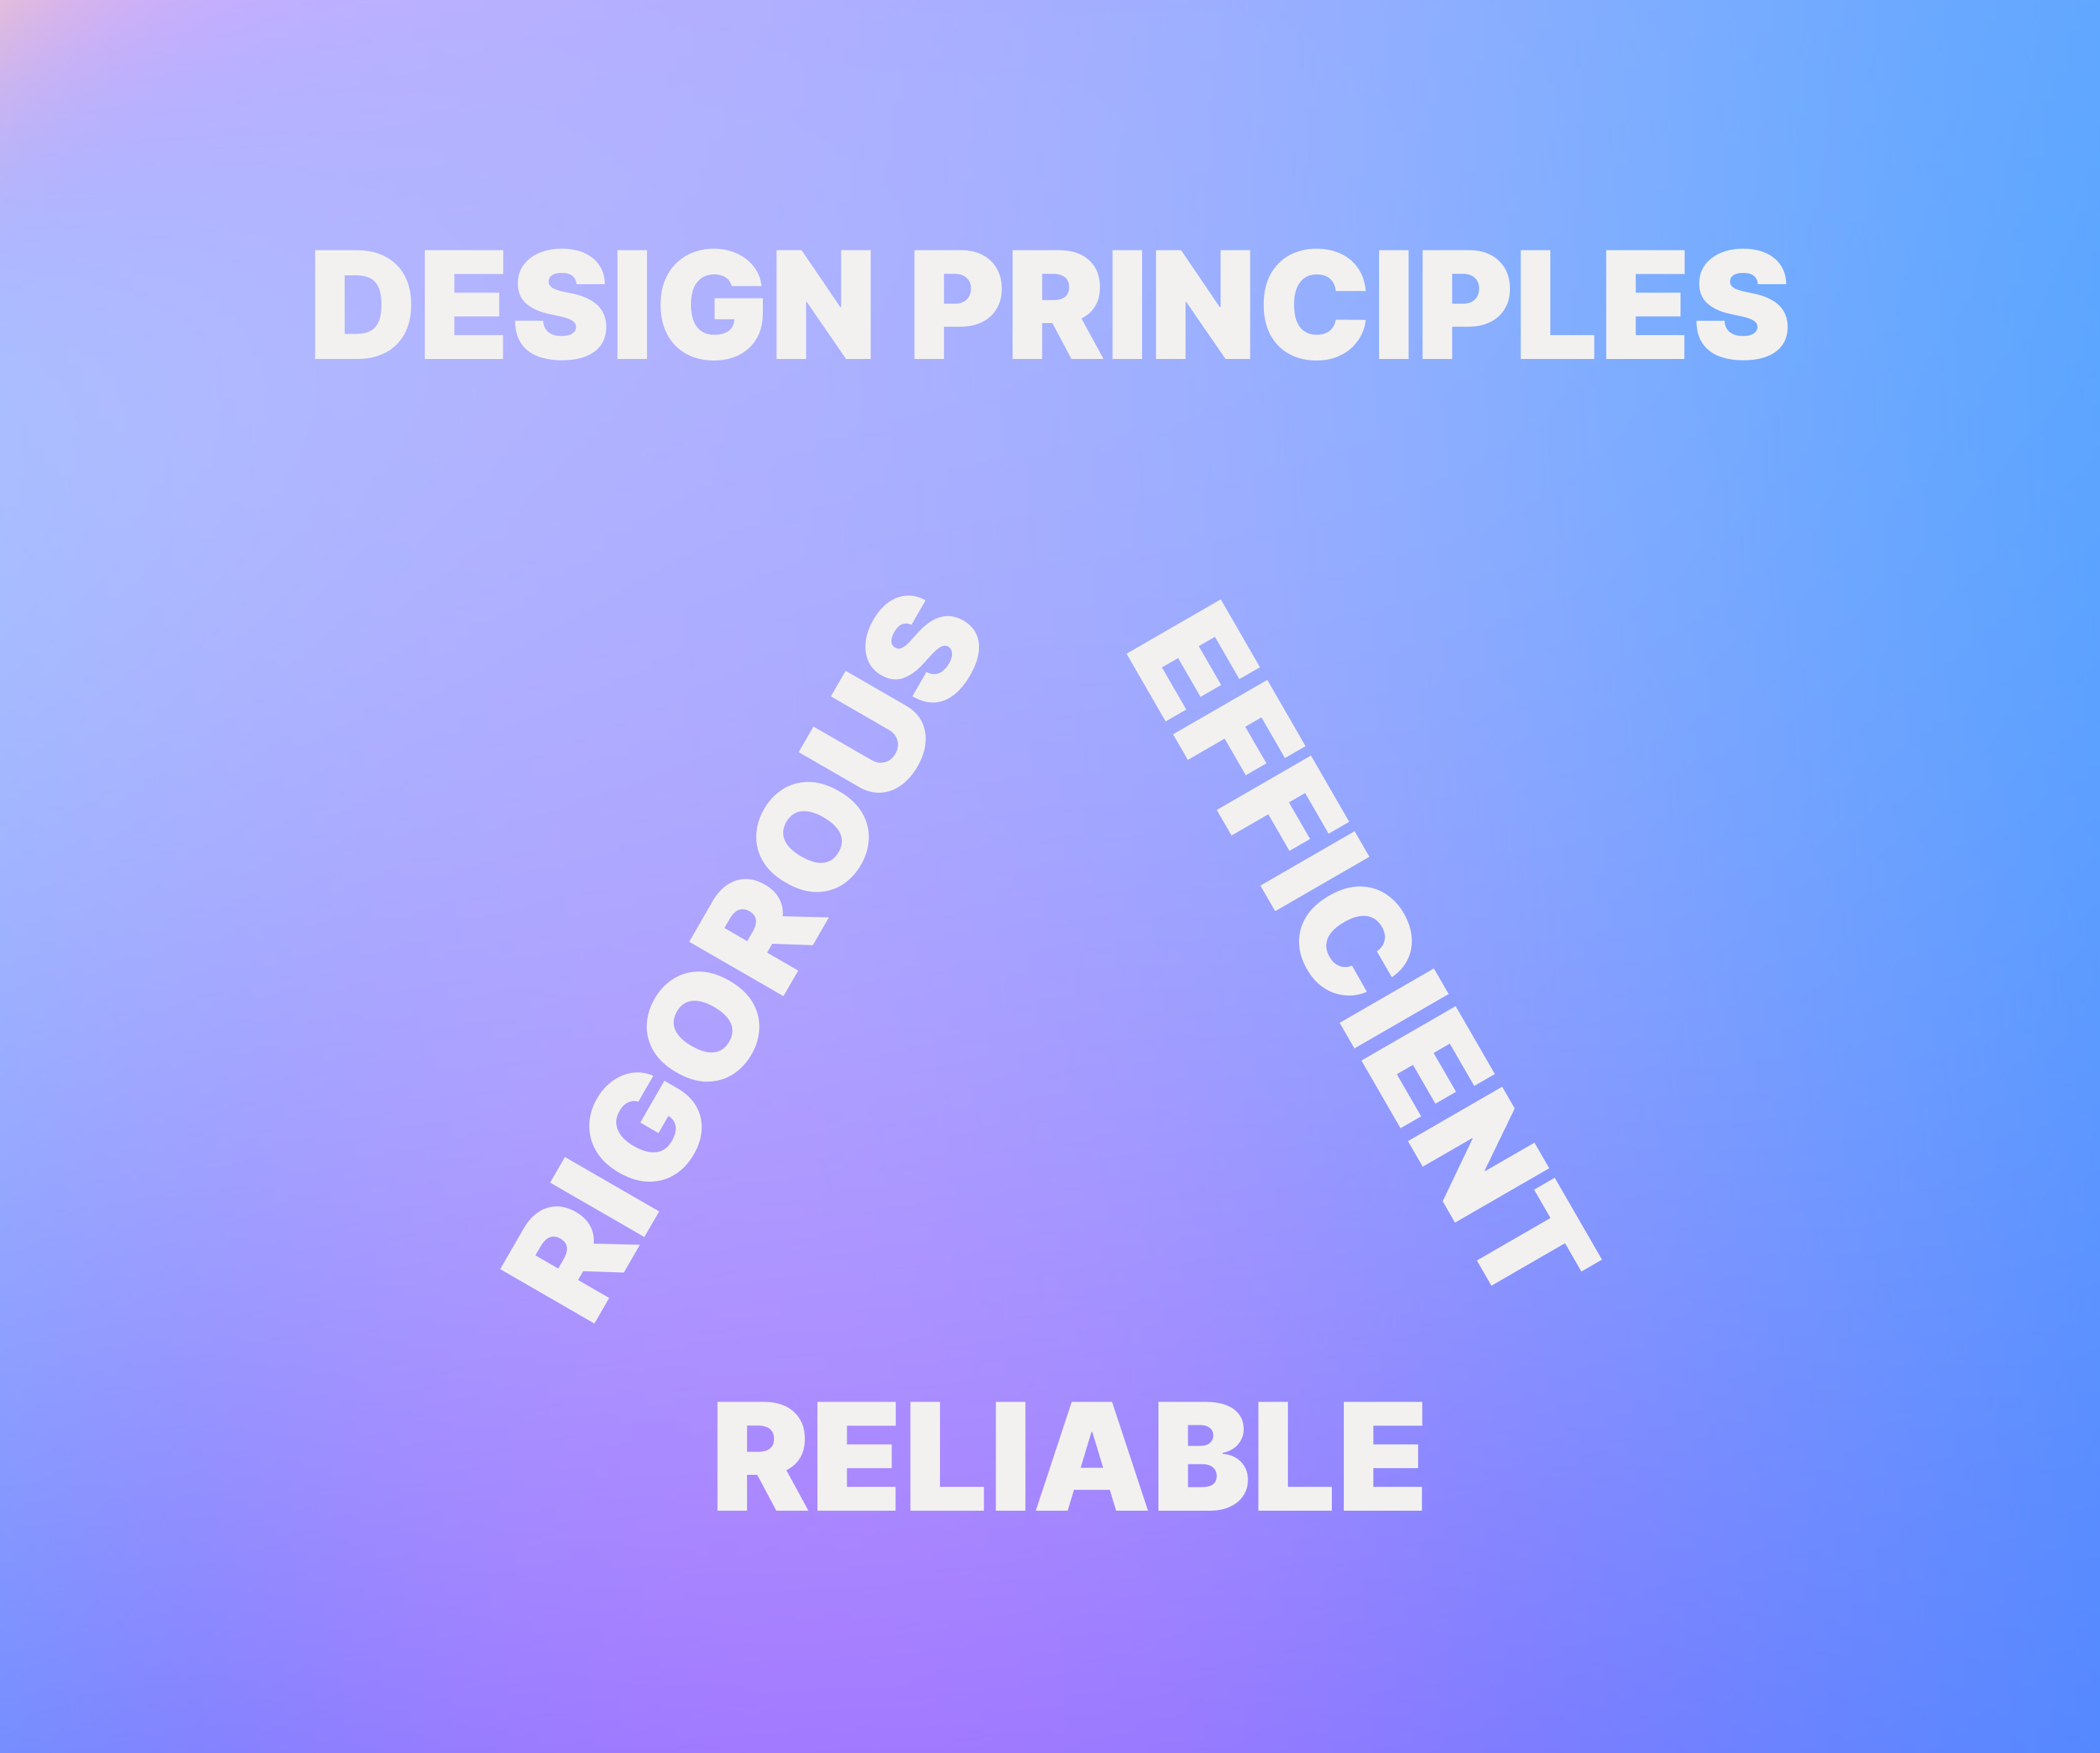
We translated Semi’s enterprise product context into three design principles: rigorous, efficient, and reliable.
These principles led to several key design decisions:
- High-contrast palette
- Small corner radii
- Subtle spacing
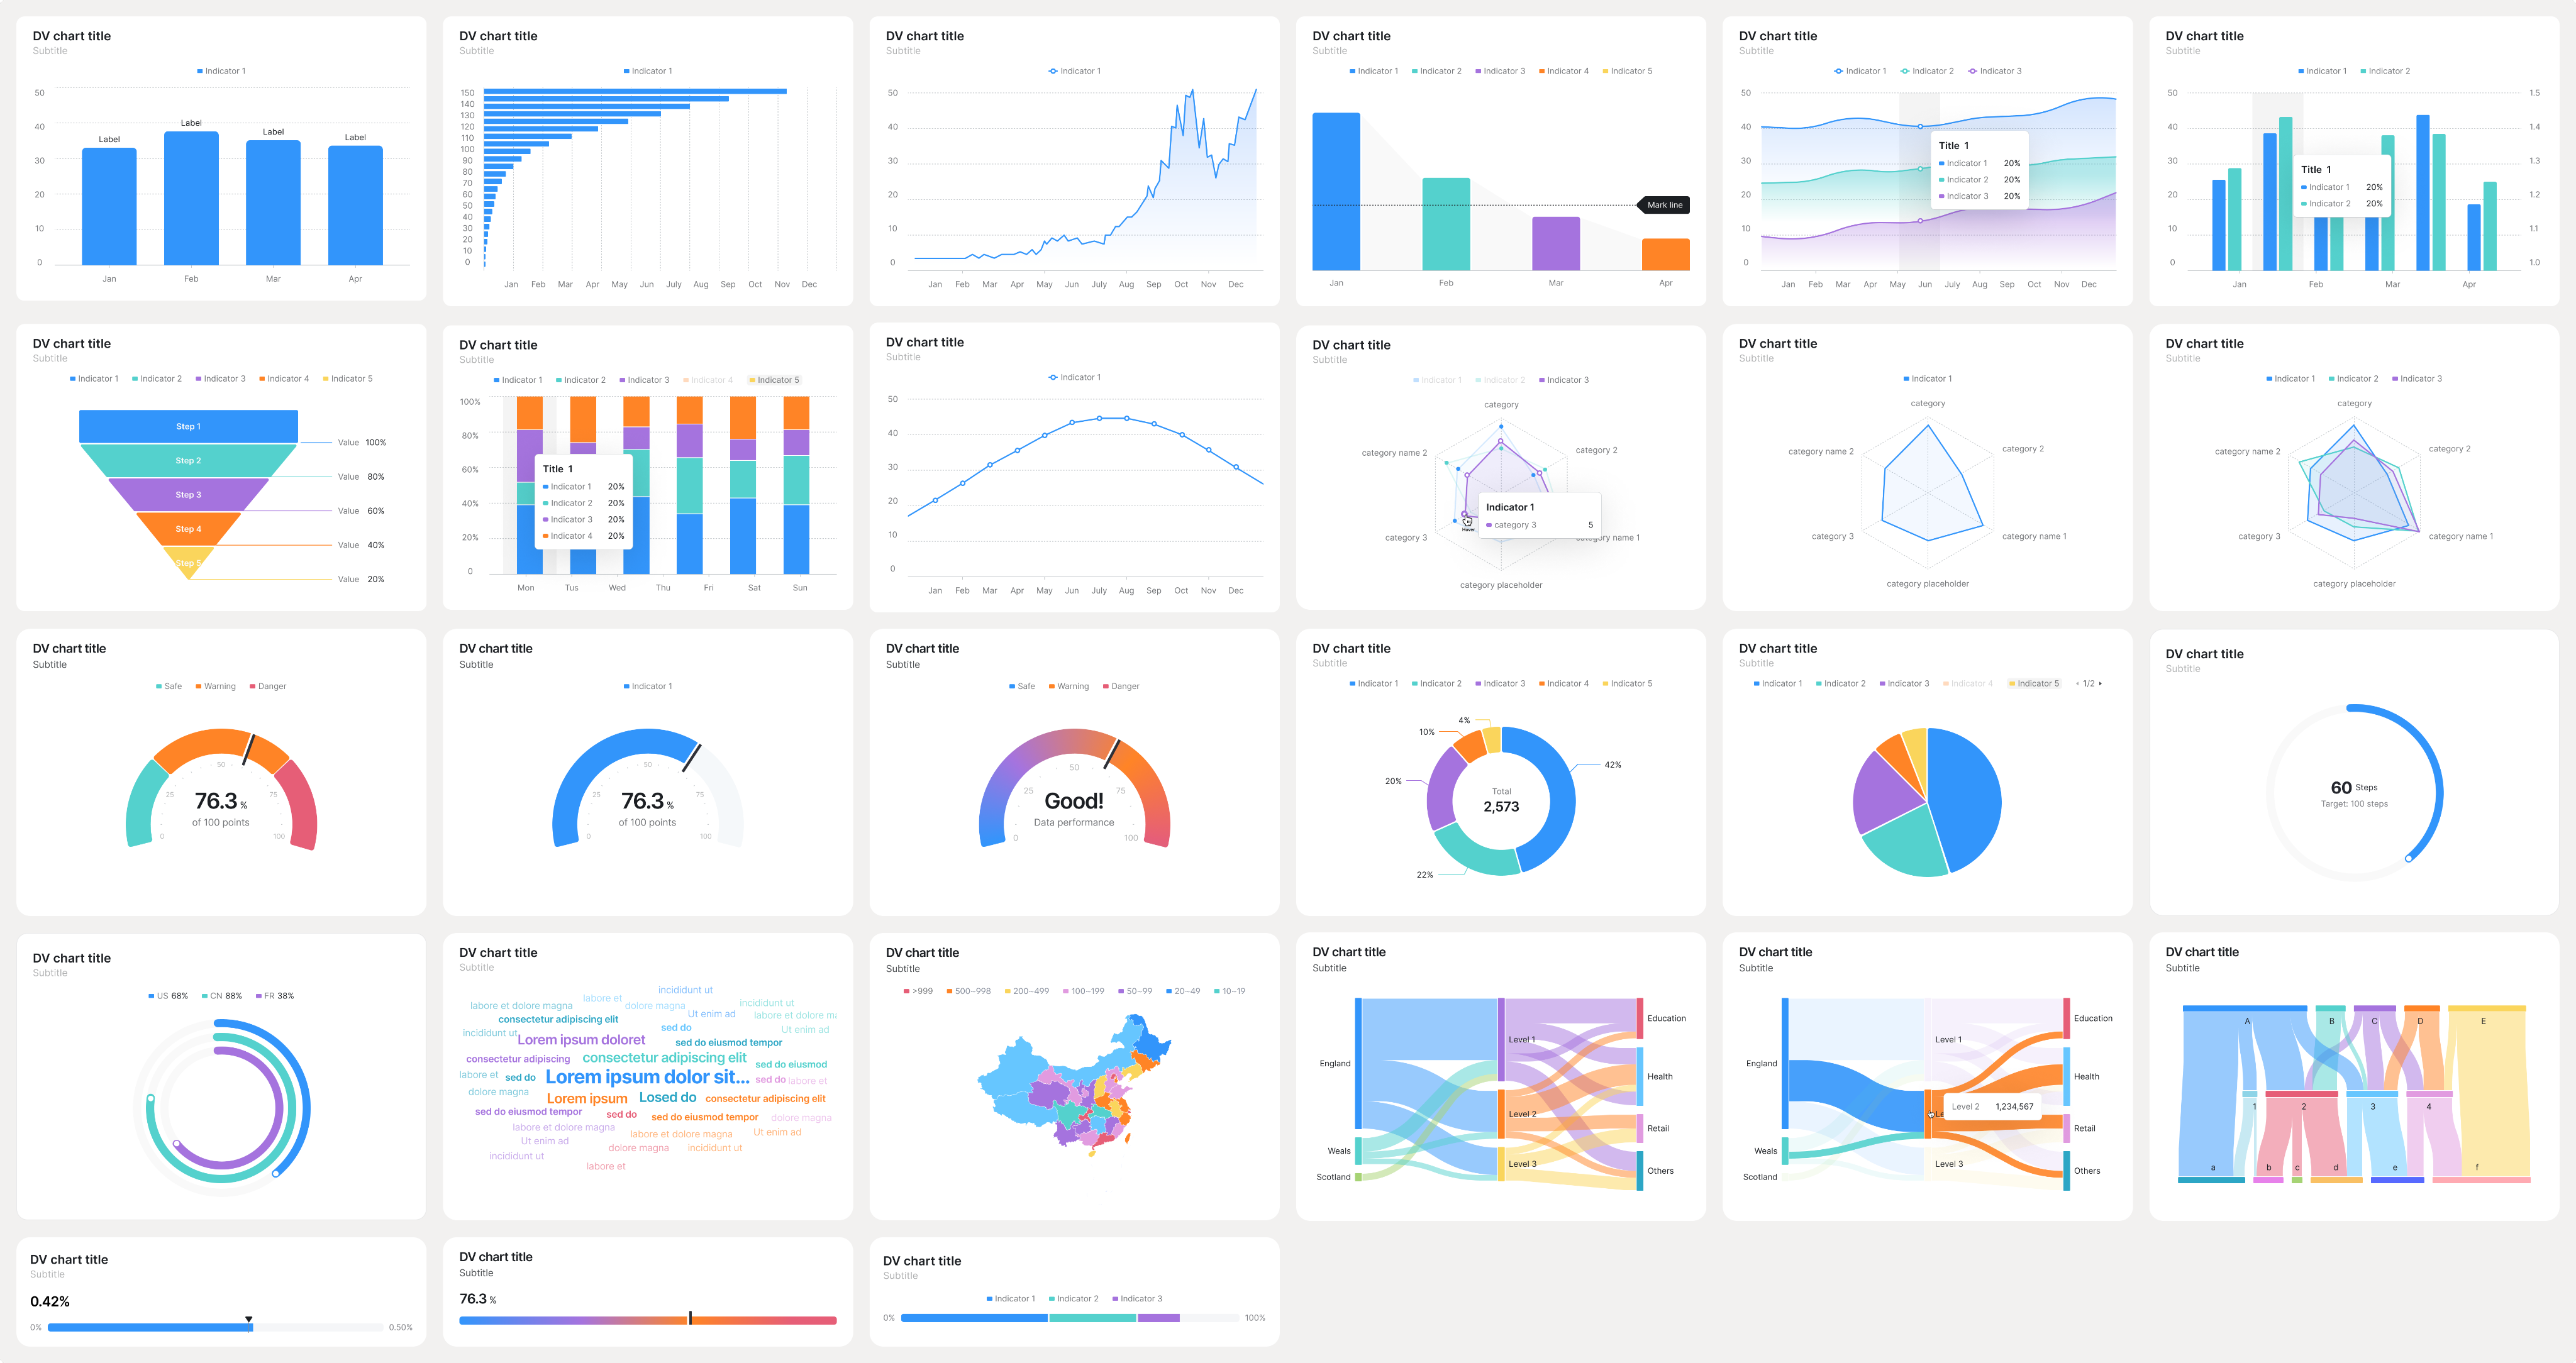
From 32 chart categories, I selected the 10 most commonly used types as the priority for the first release
Theme builder.
Simple when possible. Powerful when needed.
Research exposed two competing needs: most users wanted speed; experts needed granular control. We designed two modes—not two fixed personas—so the same designer can switch depth by task.
Simple mode
A usable theme ready in minutes
Brand color, palette, corner radius, spacing, and line weight, simple mode only focused on variables with the greatest visual impact.
Entering a brand color generated a distinct chart palette, while real-time previews showed system-wide changes
Advanced mode
Control from system to chart
For deeper customization, I reorganized code-heavy parameters around the engineering model: system styles, shared components, and chart-specific controls.
Every change appeared instantly in a live preview—making configuration easier and keeping design and code aligned.
Deliverable 02 - Chart application
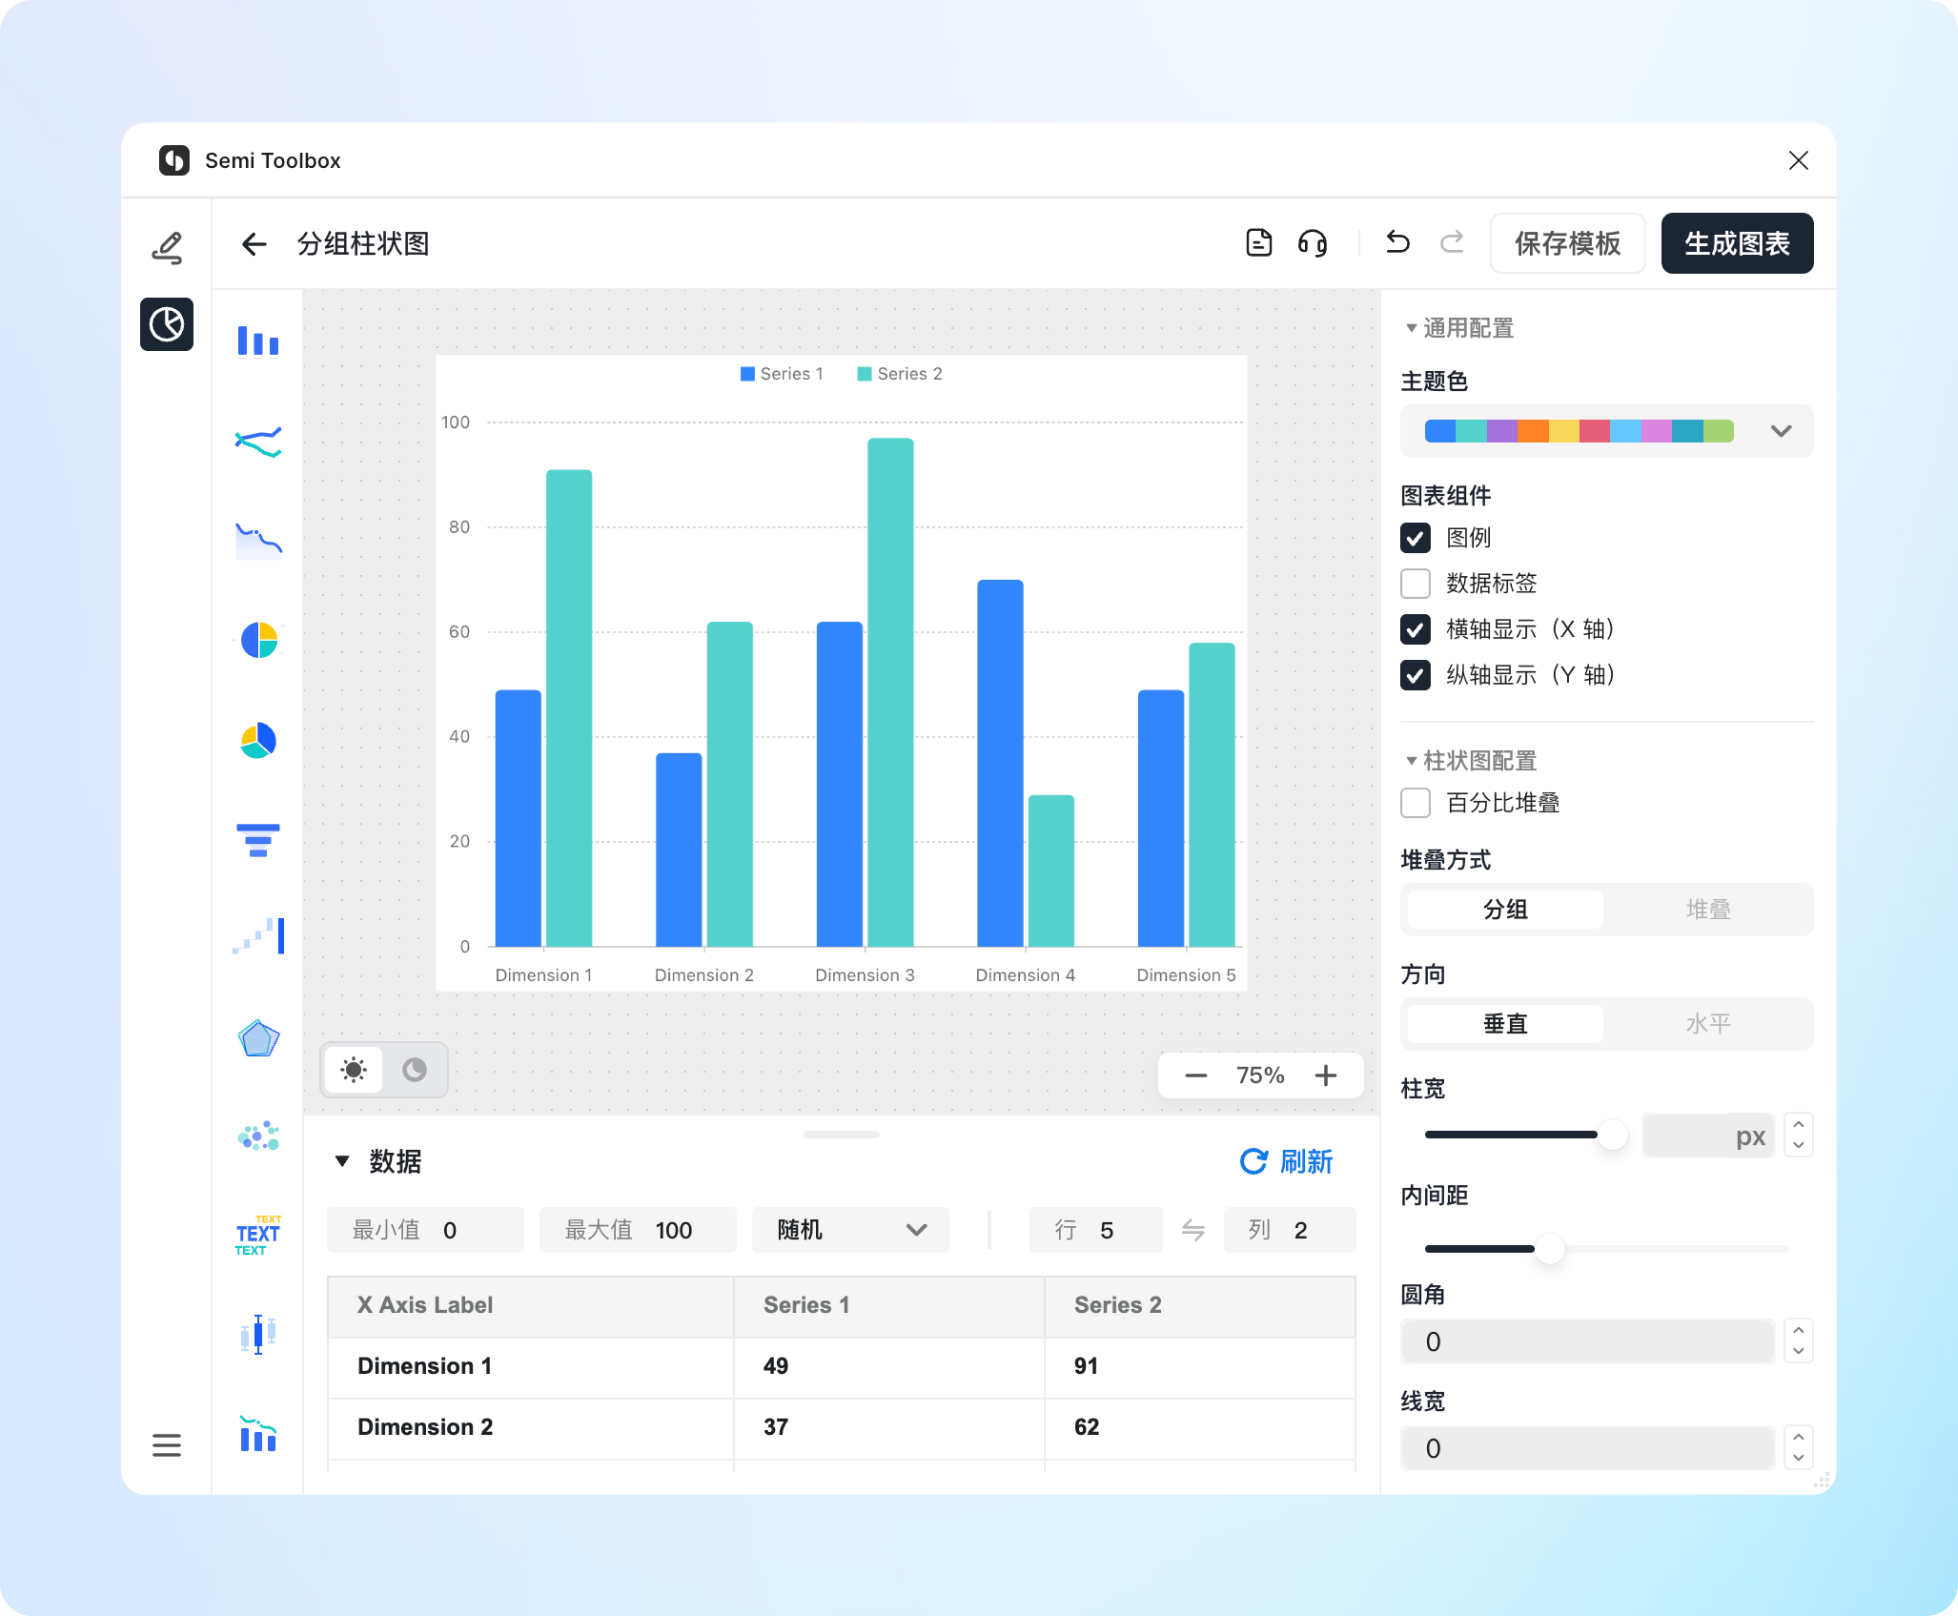
Three focused tools connected chart selection, Figma creation, and engineering handoff—turning a fragmented process into one continuous workflow.
/ 01 - Choose
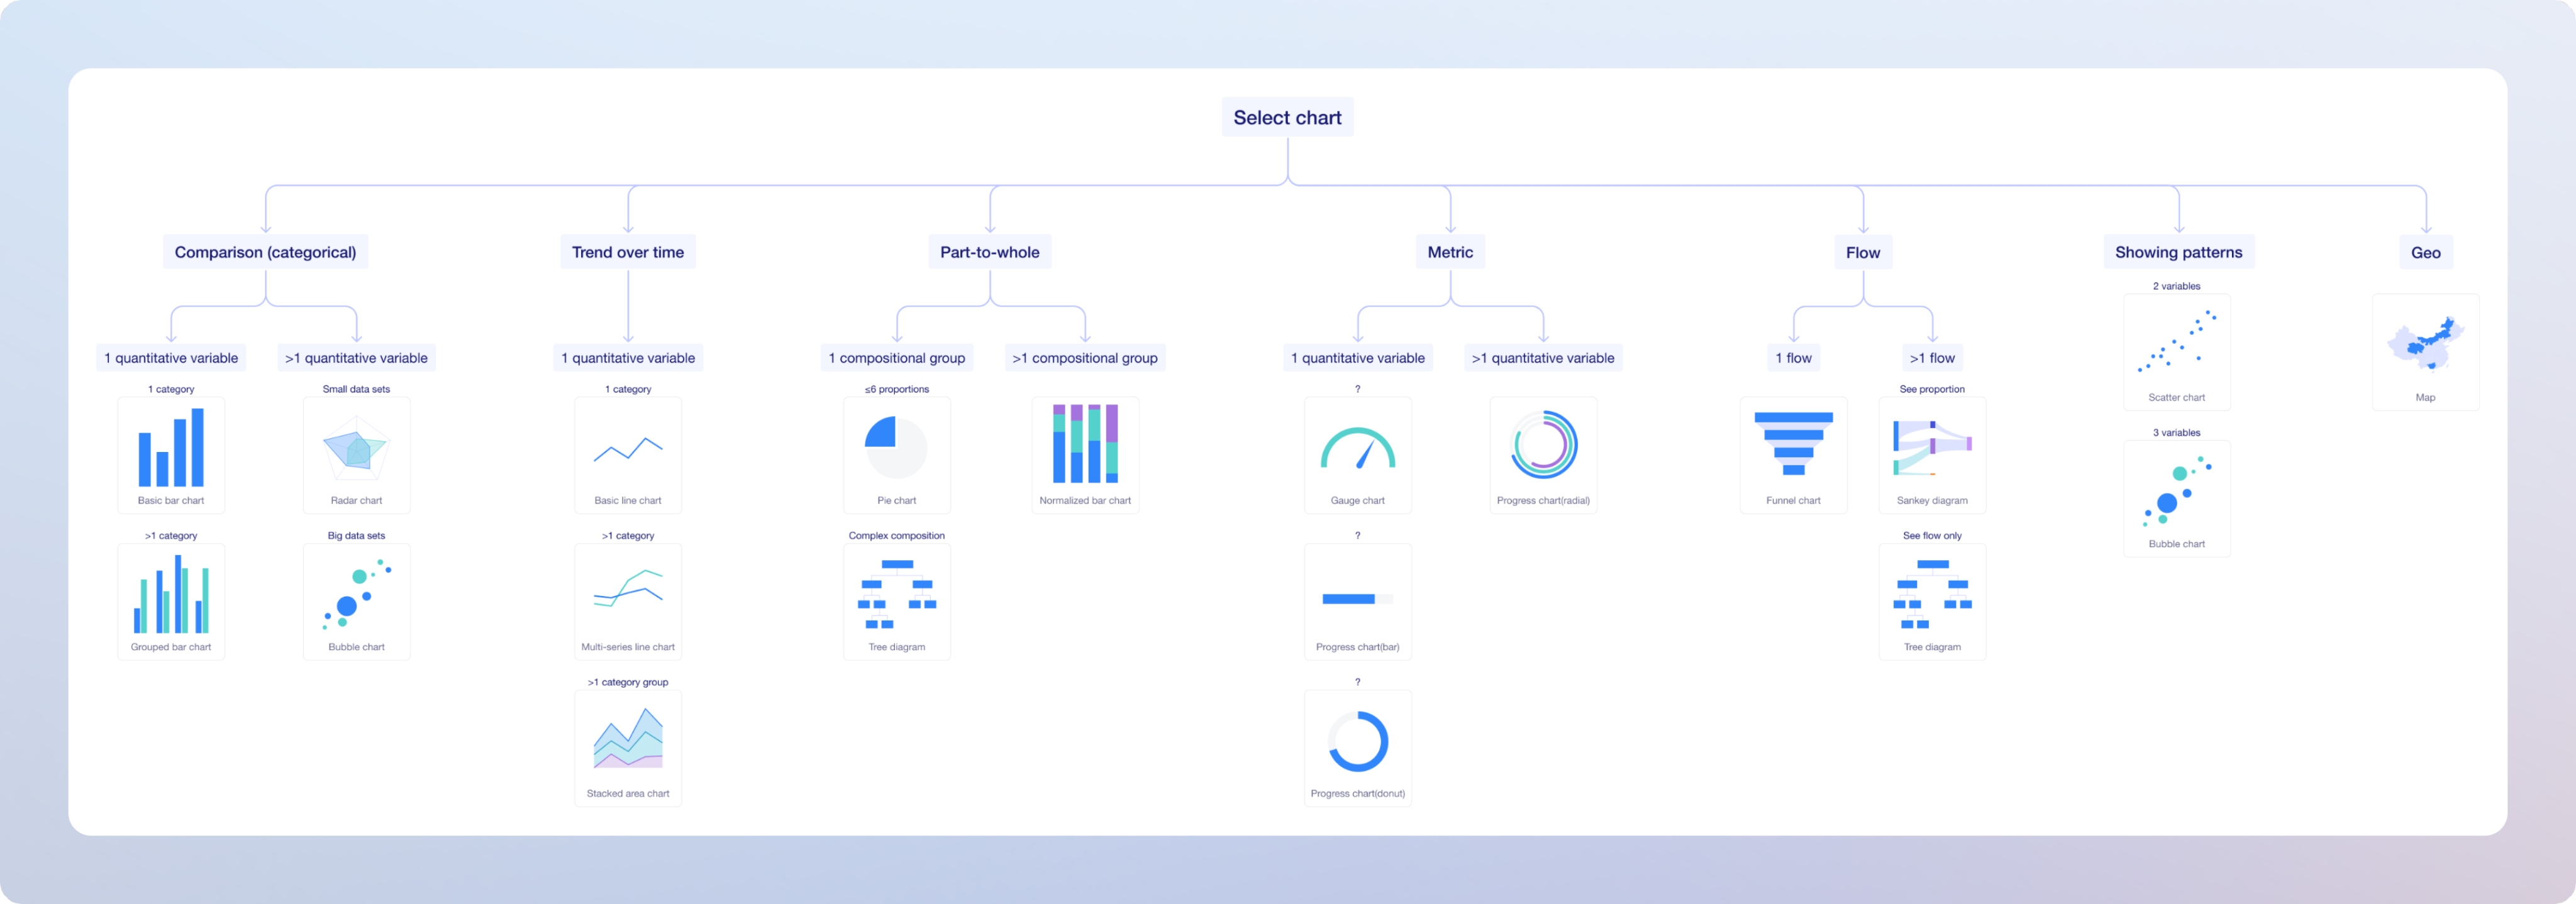
Chart selection guide
Select chart by analytical task and data relationship.
/ 02 - Design
Semi Figma plugin
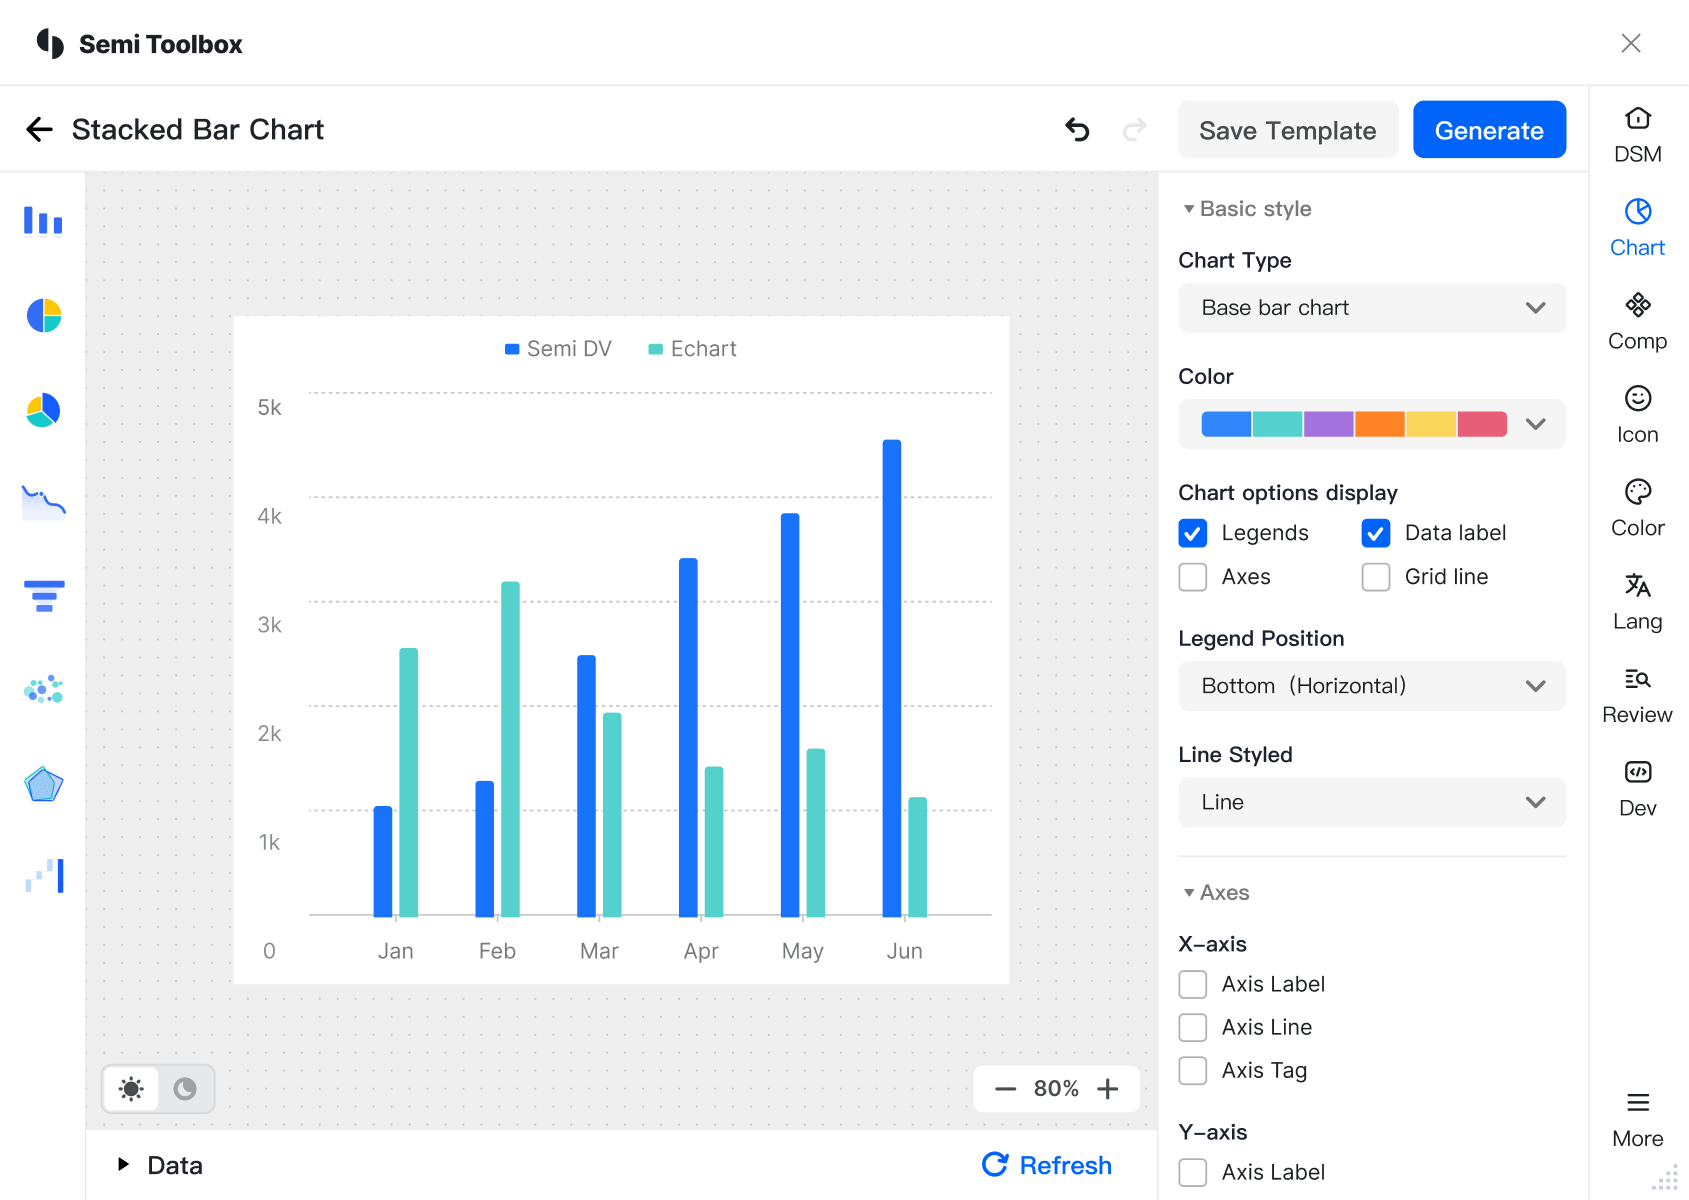
Sync themes and insert charts in one click - no manual reconstruction.
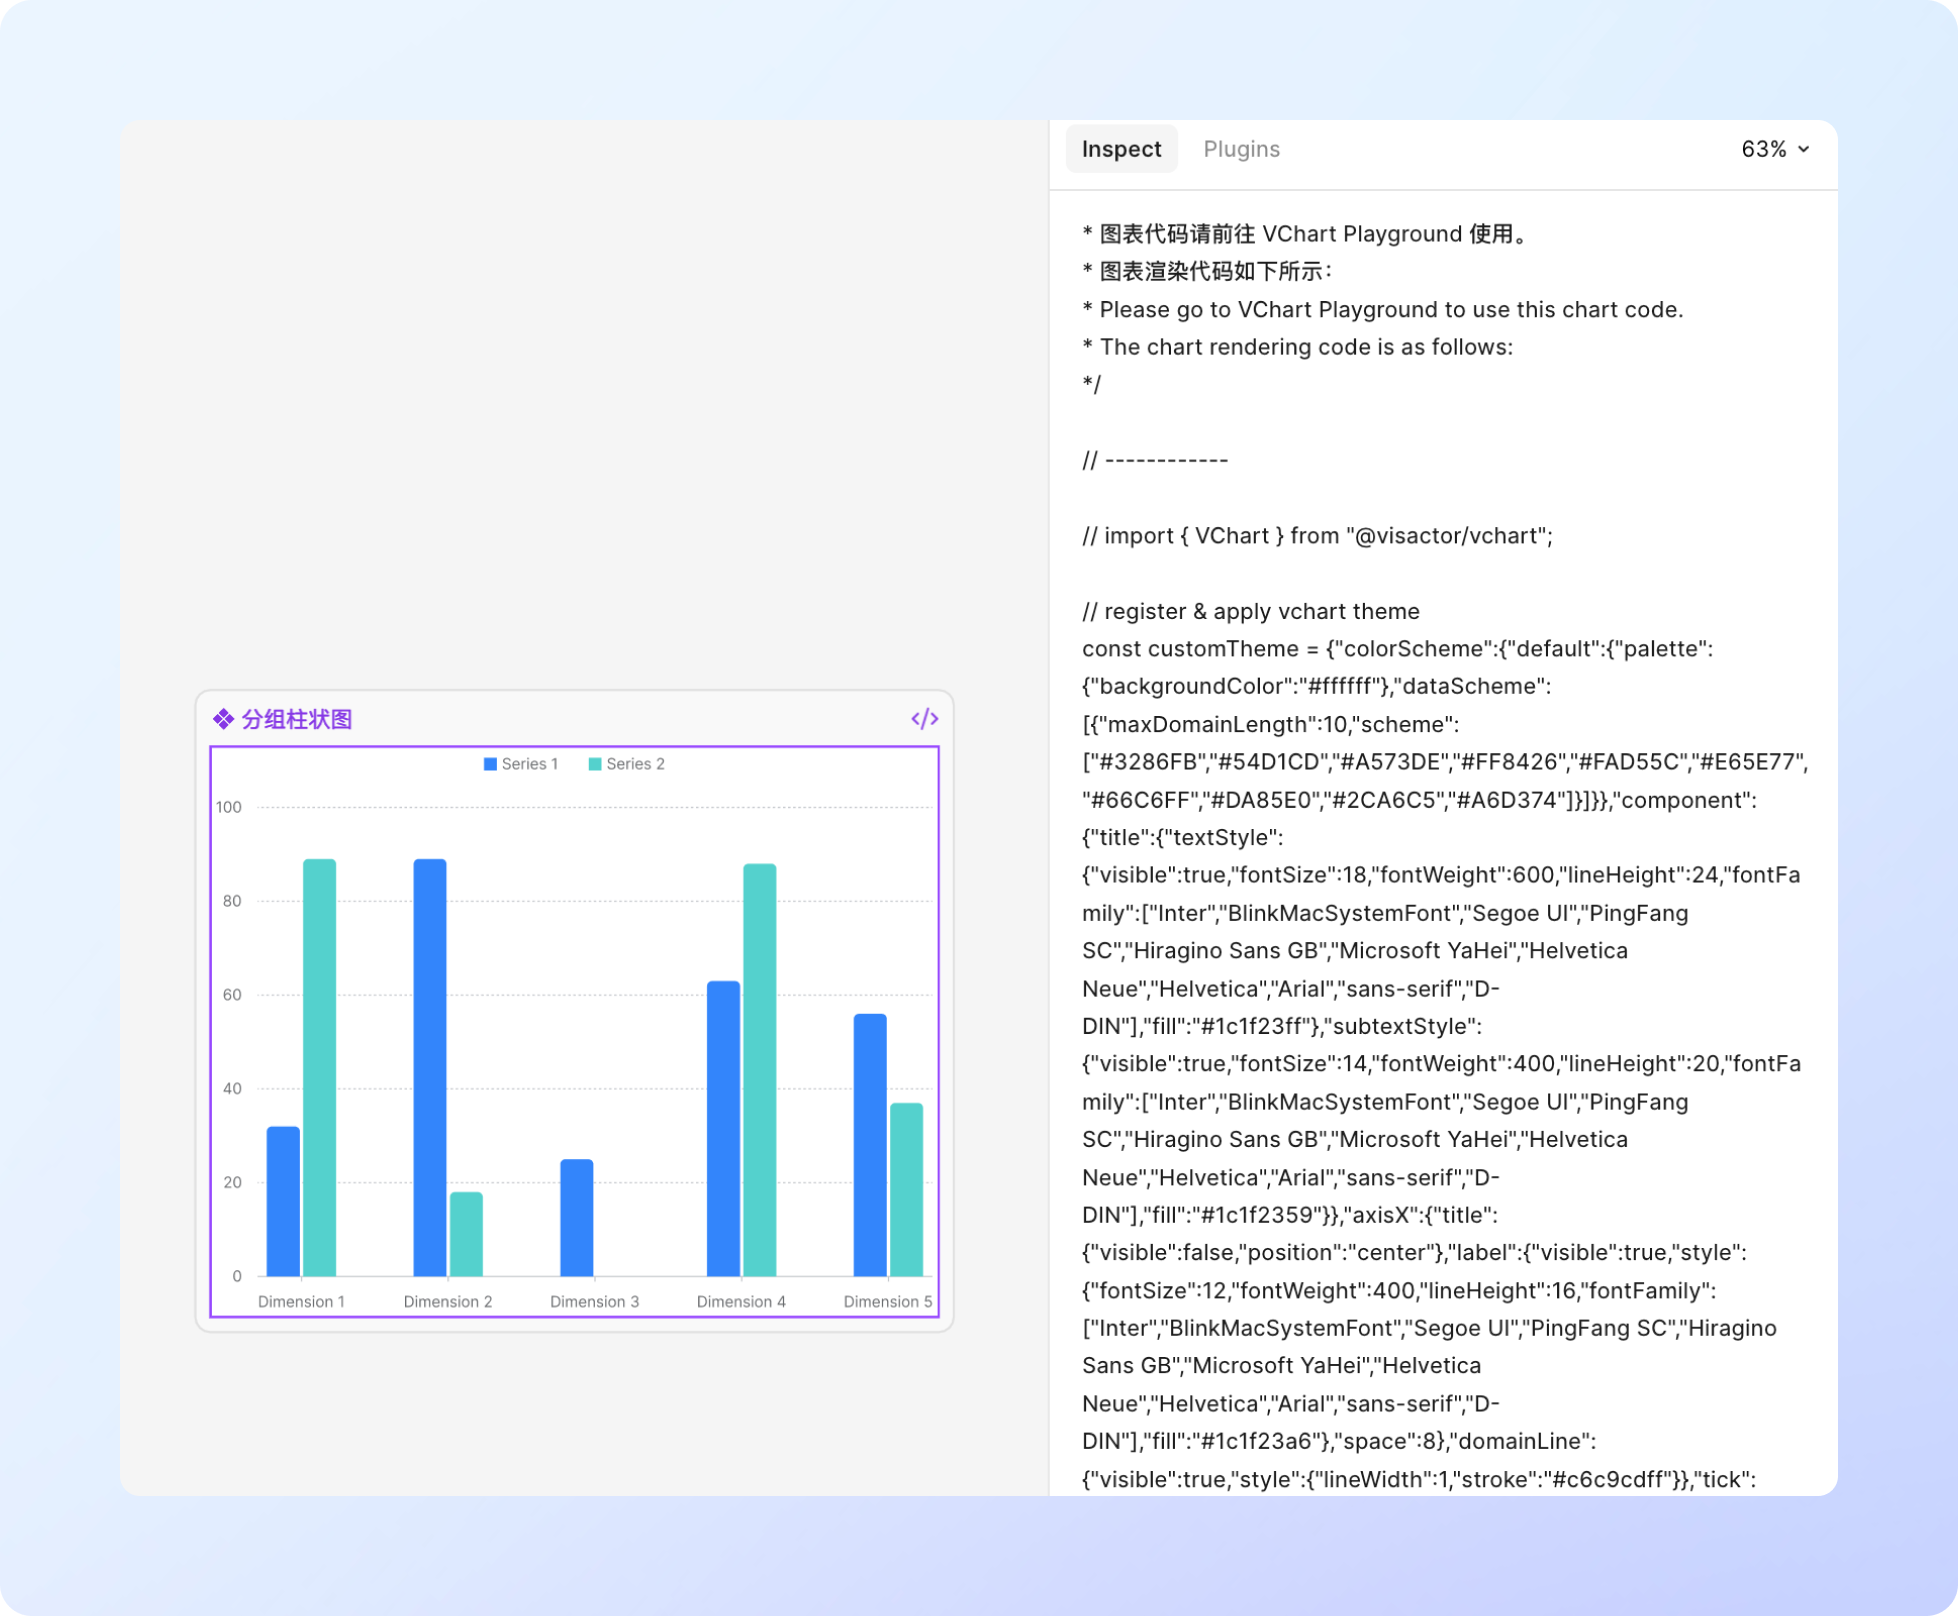
/ 03 - Build
Figma description
Engineers copy the generated configuration directly
from the Figma description.
Launch
Semi DV officially launched in December 2024 and was introduced across Byte Tech and TikTok Design All Hands.
Impact
Adoption
The release established a common visualization foundation across ByteDance products and the border ecosystem
60+
ByteDance teams reached
200+
Semi teams supported
Efficiency
Semi DV streamlined the complete data visualization workflow—from chart selection and theme definition to design and engineering delivery.
Due to an organizational restructuring, we were unable to collect complete post-launch performance data. Based on workflow testing, the estimated improvements were:
Chart style definition per project
90 person-days

1 person-days
Creating a single chart in Figma
2 hours

5 minutes
Implementing a single chart
4 hours
10 minutes
Long-term partnership
The project established a strong foundation for continued collaboration with Semi, and led to several follow-up initiatives.
Reflection
Speed versus perfect
To deliver the cross-team project within eight months, I concentrated most of our resources on completing the most differentiated capability: theme customization.
This trade-off helped us launch on schedule, but the MVP still had several limitations:
- Palette generation supported only a limited number of strategies
- Advanced Mode still involved a learning curve. Users could not configure an element by selecting it directly in the chart preview
- Support for additional chart types and complex scenarios remained limited
Future improvements could include multiple palette-generation strategies, direct editing within the chart preview, and more comprehensive configuration guidance.
Ownership over coordination
This project involved several design and engineering teams. During the process, I learned that a shared timeline only addresses the visible dependencies between teams.
What sustains collaboration is giving every participant clear ownership, room to make decisions, and work that is visible and recognized.
The experience reshaped how I think about project management: it is not only about delivering work on time, but also about creating a shared sense of responsibility and achievement around a common goal.